November… what’s doing?! The monthly quote tradition… we told you we’d continue it. It’s sure starting to get chilly, but boy does it look beautiful outside! We loved this quote from Sarah Addison Allen’s First Frost and thought it perfectly encapsulated November scenery in Toronto. A cobbler crust of brown sugar and cinnamon…. who’s hungry? I am!
We are well into the Fall market, with December 21st being the first “official” day of Winter. In non-COVID times, we typically see the real estate market pick up in Fall. While not as crazy as Spring, historically, Fall has proven to be the second busiest time for the real estate market. Now, let’s talk about October!
As of Thursday November 4th, 2021, 78.16% of the total Canadian population has received at least one dose of the COVID vaccine and 74.22% of the total Canadian population are fully vaccinated. That’s more than 58,904,422 doses of approved COVID-19 vaccines that have been administered across Canada.
A Plan to Safely Reopen Ontario and Manage COVID-19 for the Long-Term has been released – which is far more news than we’ve had over the past couple of months! The plan outlines the gradual approach to lifting remaining public health & workplace safety measures by a target date of March 2022. Over the next 6 months, Ontario will slowly lift all remaining measures, including wearing face coverings in indoor public settings & removing the provincial requirement for proof of vaccination. Of course, should any new COVID-19 variants appear, increases in hospitalizations occur or increases in ICU occupancy and rapid increases in transmission take place, the plan will be re-evaluated as needed.
We mentioned last stats blog post that October 25th, 2021 marked the date that capacity limits were lifted in the vast majority of settings where proof of vaccination is required. Limits were also lifted in certain outdoor settings. On November 15th, 2021, the government intends to lift capacity limits in remaining higher-risk settings where proof of vaccination is required. So, that is something for some to look forward to.
And that’s what you missed on… Reopening Ontario!
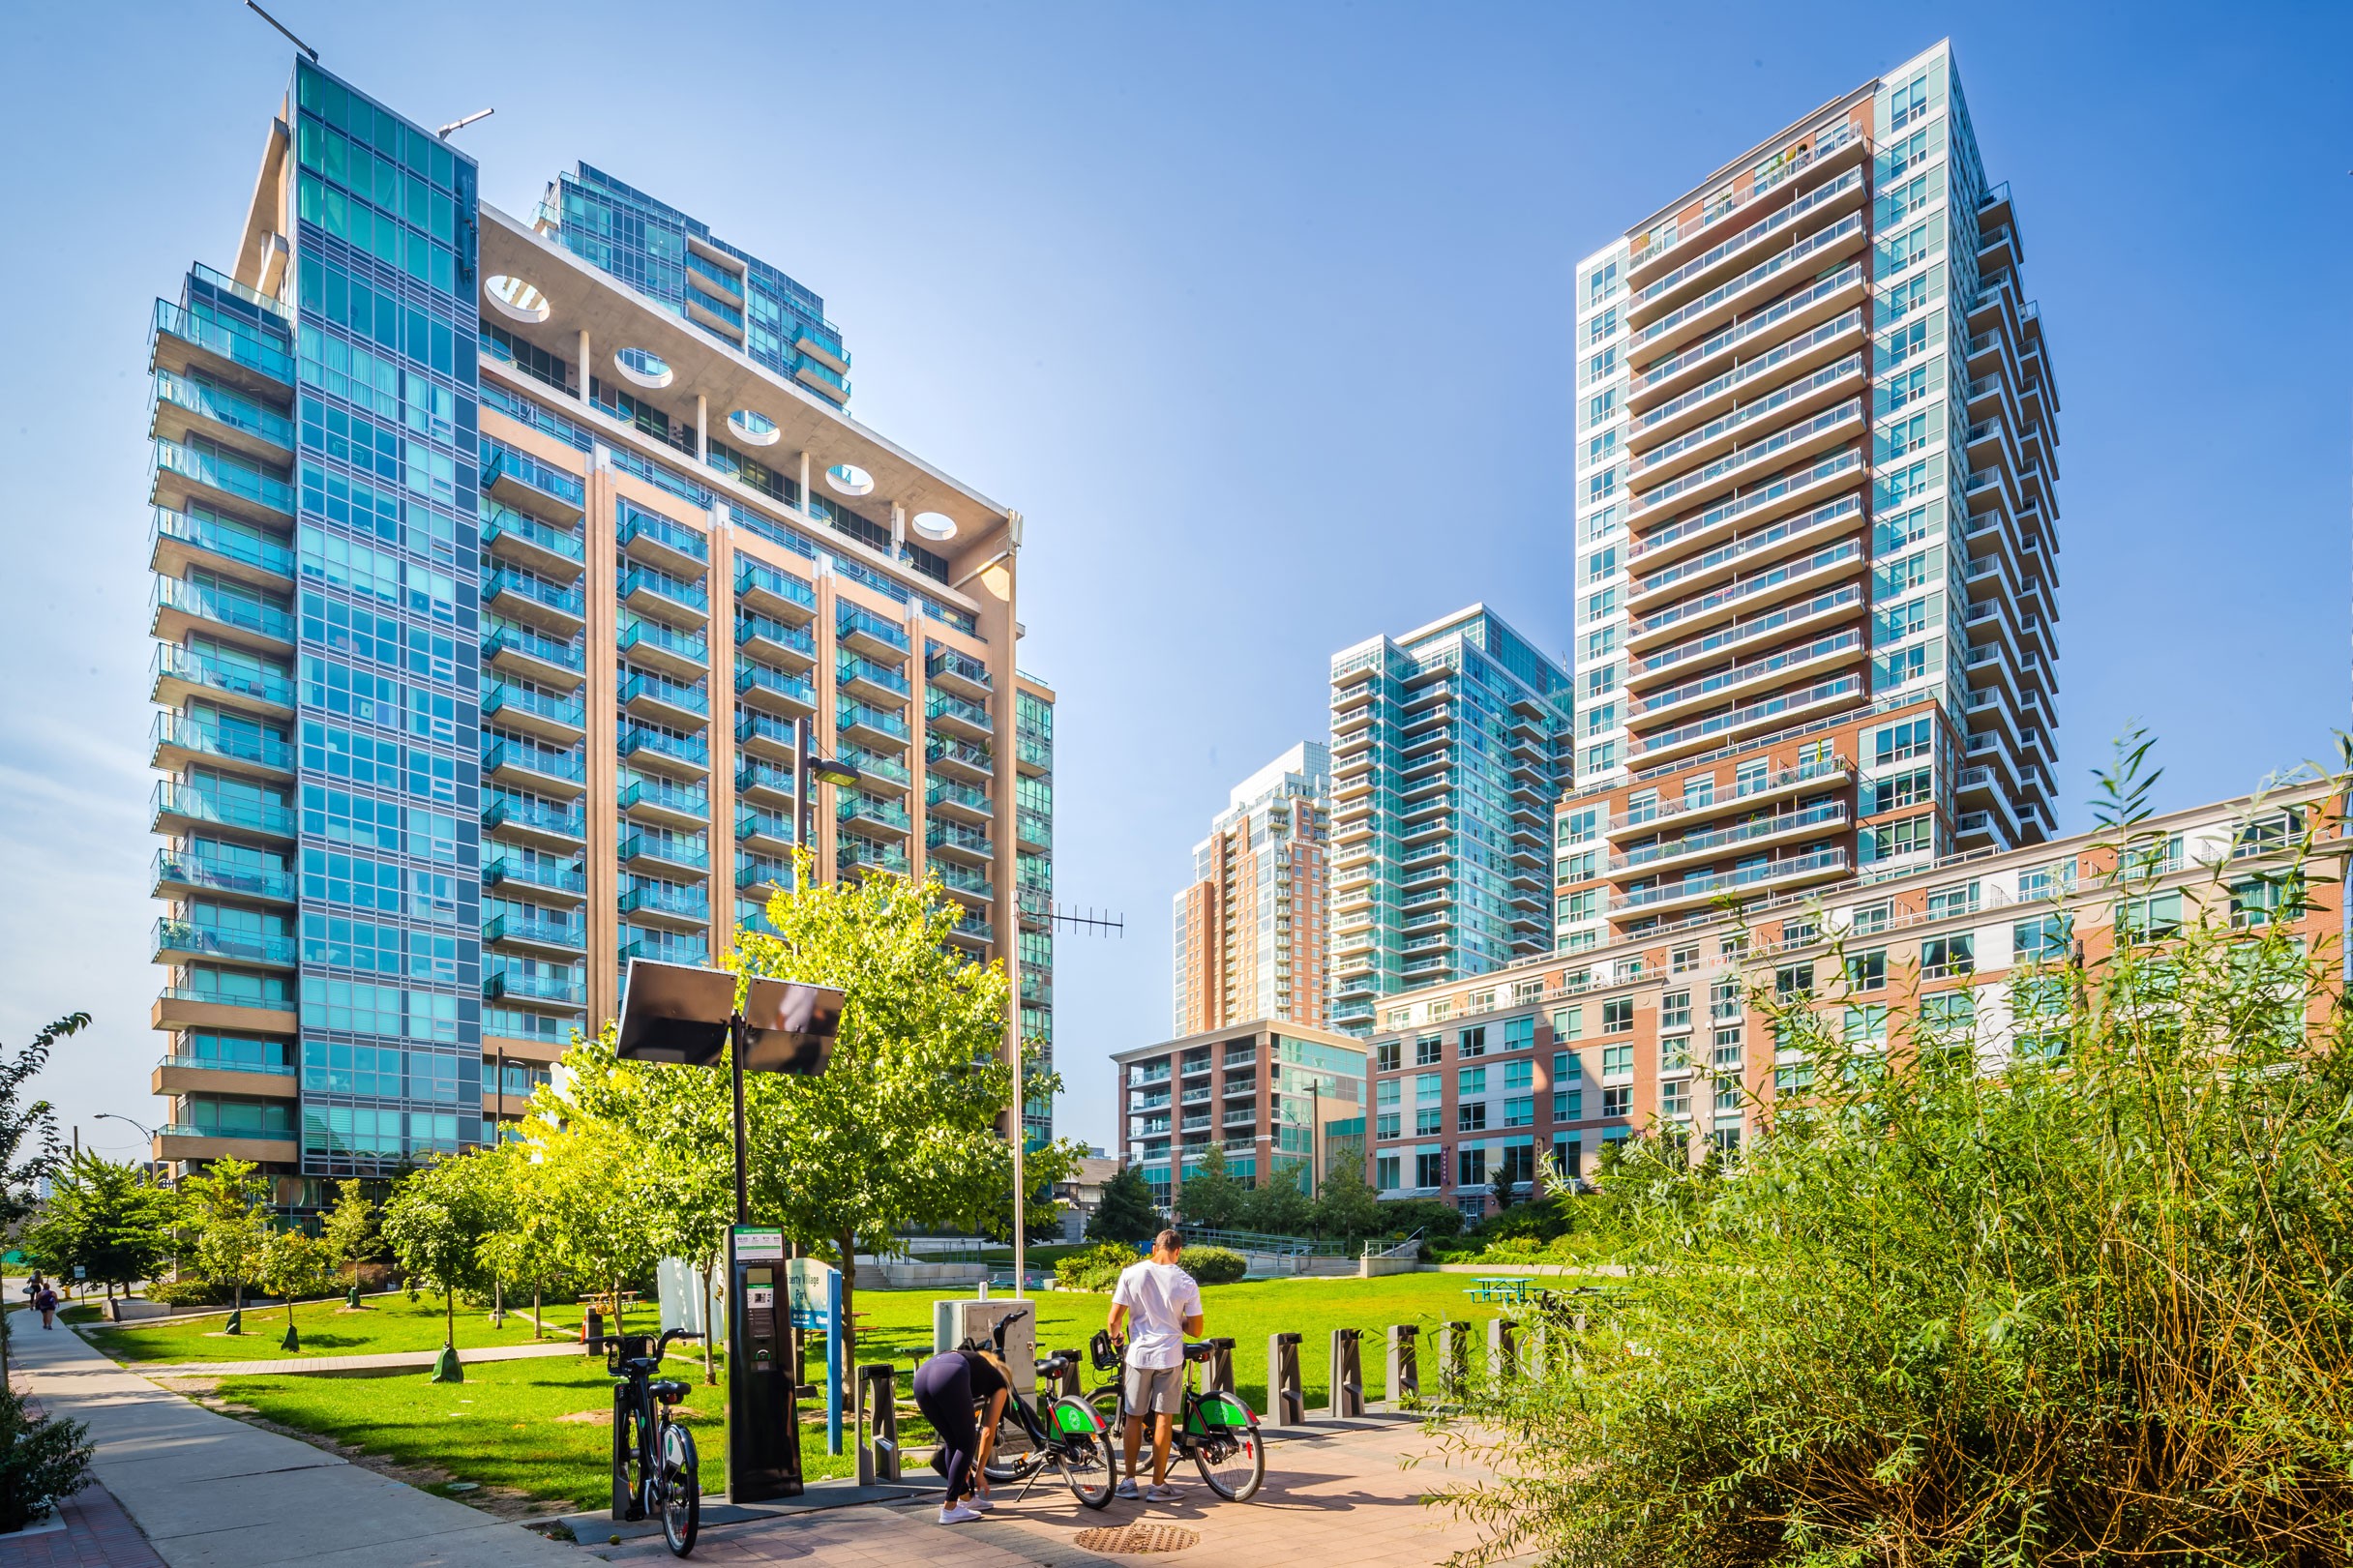
Now, on to real estate! This month, we saw a decrease in total condo sales year over year and month over month. Let’s delve into the numbers for our Liberty Village condo market in October and let them do the talking.
How Many Condos Sold in Liberty Village In October?
October 2021 saw a total of 34 condo sales in Liberty Village. In comparison, October 2020 had 56 sales. Very interesting!! A 39.29% decrease in condo sales year over year. As we can see, October 2020 was an uncharacteristically busy month for a mid-Fall real estate market. When we put this into perspective, the decrease isn’t so remarkable. The beginning of Fall tends to be a busy time for the real estate market, but then, as the weather gets cooler and we head closer and closer to Winter, it starts to slow. So, not surprising! In terms of month over month, there was a 27.66 decrease in condo sales. October was a sleepy month, eh?! It won’t be surprising, though, if sales continue to slowly decrease until we have better weather. Like we said in last month’s stats blog post, winter, historically, is the quietest real estate month & then Spring is where the market usually goes bonkers. To sum it up, condo sales in October decreased but the number of buyers confident enough to make their biggest lifetime purchase was still a healthy number for mid-Fall. Let’s not forget, this is all despite being almost 2 years into a global pandemic.
Sales volume tells us part of the story. Let’s look at prices. Did values increase, remain the same or decrease from October 2020 to October 2021? Let’s take a look at the average sale price for all types of condo sales year over year.
The average sale price in October 2021 was $773,438 on the 34 sales. The average sale price for the 56 sales in October 2020 was $703,939. An amazing 9.87% year over year increase in sale price. Very nice! A notable increase and one that we are very pleasantly surprised with. This means that the average sale price for condos/townhomes in Liberty Village raised a near 10%. Now, what about sales volume month-over-month? The average sale price in September 2021 was $779,548 on the 47 sales. A 0.78% month over month decrease in sale price. Hardly there! So, sale price is pretty much remaining consist from last month to this month and increase by heaps and bounds, year-over-year!
The average sale price in October 2021 was $773,438 on the 34 sales. The average sale price for the 56 sales in October 2020 was $703,939. An amazing 9.87% year over year increase in sale price. Very nice! A notable increase and one that we are very pleasantly surprised with. This means that the average sale price for condos/townhomes in Liberty Village raised a near 10%. Now, what about sales volume month-over-month? The average sale price in September 2021 was $779,548 on the 47 sales. A 0.78% month over month decrease in sale price. Hardly there! So, sale price is pretty much remaining consist from last month to this month and increase by heaps and bounds, year-over-year!
The Liberty Village condo market for October 2021 has proven exciting! The beginning of the Fall Market started with a huge BANG & sales prices, year over year, are banging too! With all these exciting stats, it’s important to remember that the colder weather is, historically, a huge determinant for the business of the real estate market. Going forward, we’re excited to see the remainder of Fall and beginning of the Winter market. Make sure you have your seatbelt on, it’s going to be a wild ride!
Any predictions for next month, the remainder of Fall or the Winter market? Let us know in the comments below.
If you have any specific questions about the market or are curious as to how this relates to your Liberty Village condo, get in touch. You can fill out our Condo Value Form or send us an email.


[…] Curious how October 2022 differed from the year before? Take a look back at our post for the Liberty Village condo stats in October 2021. […]